
Buying Second-Hand ASICs With a Ranking Table
A resale listing tells you how many terahashes a machine produces; the number that decides whether it is worth buying is the electricity price at which it stops paying. At current difficulty, 250 TH/s earns about $9.12 a day after the listed fee, so a 30 J/TH unit drawing 7.5 kW breaks even at $0.0507/kWh, while the same 250 TH/s at 15 J/TH survives a tariff of $0.1013/kWh. One of those machines is only viable next to cheap power.
Key takeaways
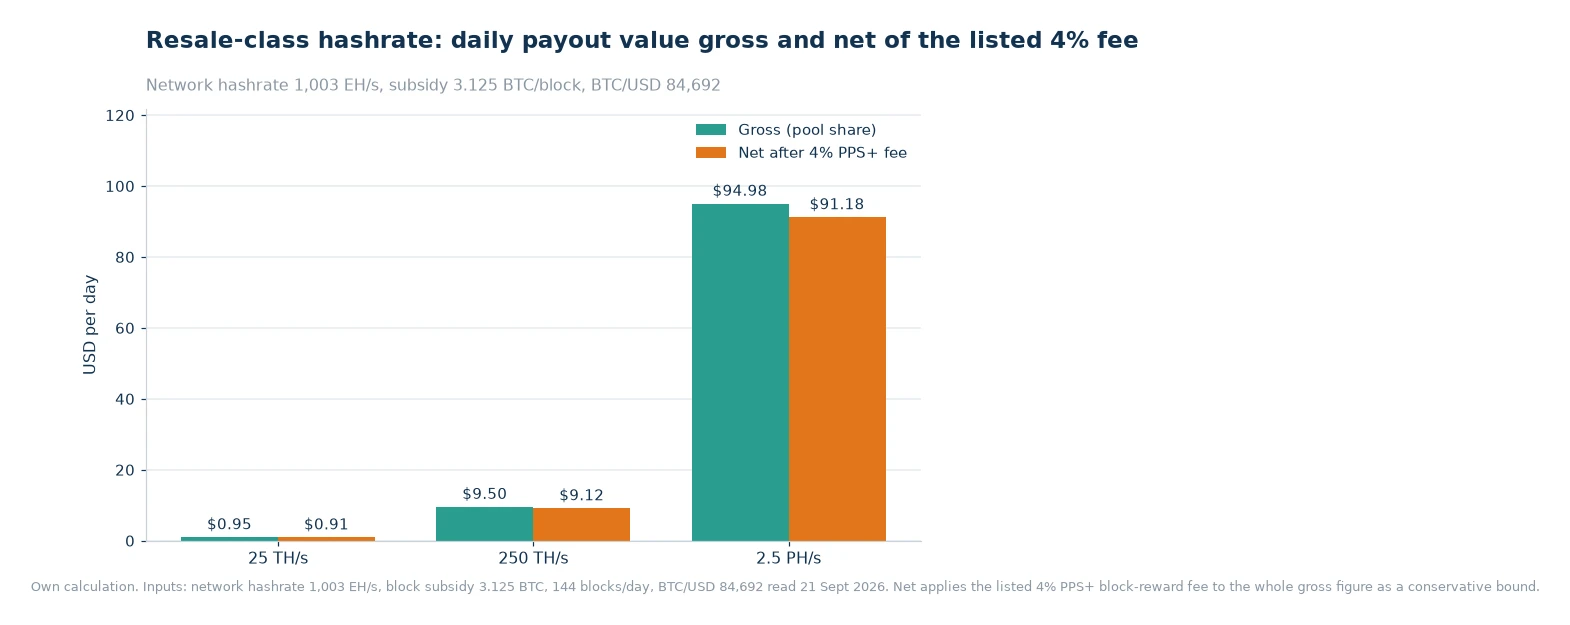
- Ranking tables show revenue, which is identical for identical hashrate. At 25 TH/s, 250 TH/s and 2.5 PH/s the gross daily values are about $0.95, $9.50 and $94.98 — the differences between a good and a bad purchase live entirely on the cost side.
- Break-even electricity price is the single most useful figure when bidding on used gear: 250 TH/s at 30 J/TH tolerates $0.0507/kWh, at 20 J/TH $0.0760/kWh, at 15 J/TH $0.1013/kWh.
- A difficulty adjustment in either direction changes every one of those numbers: network difficulty was 132.76 T on 21 September 2026 with an estimated −2.12% change at the next adjustment.
- Ask for per-worker hashrate history and an efficiency figure before paying, because a machine that has drifted below its rated hashrate will never show that in a ranking table.
Definitions first
Four numbers do all the work in a second-hand purchase, and only one of them appears in the advertisement.
Hashrate is the work a machine performs, measured in TH/s. It sets the numerator of your revenue: your hashrate divided by network hashrate, multiplied by the 450 BTC the network issues each day, multiplied by one minus the listed pool fee.[1]
Efficiency, in joules per terahash, converts that hashrate into a power bill. A 250 TH/s machine at 20 J/TH draws 5 kW; at 30 J/TH the same output draws 7.5 kW. Same revenue, 50% more electricity.
Break-even power price is net daily revenue divided by daily kilowatt-hours. It is the highest tariff the machine can run on without losing money, and it is the only figure that makes two listings directly comparable.
Uptime is the share of the day the machine actually hashes. Revenue scales with it; power cost does not fall as fast as you would like, because a machine that is powered but idle still draws.
The trade-off nobody prices
Used listings cluster at two ends: older units with high joules per terahash sold cheap, and newer units with better efficiency sold closer to their original value. The ranking table is honest about both — it reports the same revenue per terahash for each — which is why it is a starting filter rather than a verdict.
What the table cannot price is the tariff the buyer will pay. At $0.06/kWh, a 30 J/TH unit of 250 TH/s pays $10.80 a day for the electricity that produces $9.12 of net revenue, and loses $1.68 a day. At $0.03/kWh the same unit clears $3.60 a day. The hardware did not change; the location did.
Difficulty adds a second, slower pressure. Mining revenue scales inversely with difficulty, so a network that keeps absorbing hashrate erodes margin on a predictable schedule. The estimate read on 21 September 2026 pointed to −2.12% at the next adjustment, which is a 2.2% lift for unchanged hardware — a reminder that this variable moves in both directions and should be stress-tested rather than assumed.
Example with two setups
Two available units both rated 250 TH/s. Unit A is older and less efficient at 30 J/TH; unit B is newer and runs at 15 J/TH. Both produce 0.000112 BTC a day at a network hashrate of 1,003 EH/s, which is $9.50 gross and $9.12 after the listed 4% fee is applied across the whole figure — a conservative treatment, since the fee attaches to the PPS-settled block-reward component while the transaction-fee component carries the listed 2%. The ranking table shows them as identical, because at this level of detail they are.
| Efficiency | Power draw | Energy per day | Power cost per day | Margin per day | Break-even tariff |
|---|---|---|---|---|---|
| 30 J/TH | 7.50 kW | 180 kWh | $10.80 | −$1.68 | $0.0507/kWh |
| 20 J/TH | 5.00 kW | 120 kWh | $7.20 | +$1.92 | $0.0760/kWh |
| 15 J/TH | 3.75 kW | 90 kWh | $5.40 | +$3.72 | $0.1013/kWh |
Now apply a buyer's real electricity price. At $0.07/kWh, unit A is underwater at any meaningful uptime and unit B keeps roughly $2.82 a day. At $0.04/kWh, both work, and the cheaper older unit may even be the better deal because the purchase price gap is larger than the daily margin gap. That inversion is the whole argument for doing this arithmetic before bidding rather than after installing.
Scale the same test to a small farm and the numbers spread out in a way that makes the ranking useful again: 25 TH/s produces about $0.95 a day gross, 250 TH/s about $9.50, and 2.5 PH/s about $94.98, all before power and fees are considered. Ranking by revenue per unit is a reasonable way to shortlist; ranking by break-even tariff is how you decide which of the shortlist you can actually run.
Practical next steps
- Get the efficiency figure in writing. Joules per terahash, measured rather than rated, from a test bench or a documented power measurement.
- Ask for per-worker hashrate history. A board that reports hashrate per worker reveals drift that a single "still hashing" screenshot hides.
- Compute break-even tariff before naming a price. Net daily revenue divided by daily kWh, using current difficulty, not the difficulty of the month the listing was written.
- Stress-test at three difficulties. Run the same figure at today's 132.76 T, at 10% higher, and at 20% higher. If only the first case clears your tariff, the purchase is a bet on difficulty, not on hardware.
- Re-check the board on the day you pay. The ViaBTC Miner Ranking shows each model's profitability at the live price and difficulty, and the mining statistics page publishes the pool and network hashrate those figures are built on.[2]
- Model the whole setup, not one machine. Add merged-mining output and the tariff you actually pay in the profit calculator before committing capital.[3]
One structural detail worth knowing when comparing operators: mining earnings settled with zero-fee payouts and held inside the account that shows the dashboard keep the resale calculation honest, because the coin you mined arrives whole rather than net of a transfer charge. That is the arrangement most second-hand buyers end up using, and the mining pool overview lays out the payment methods and supported chains in one place.[4]
Frequently asked questions
What happens if my miner goes offline?
Shares stop, so expected income stops with them. Alerts and a dashboard that shows per-worker hashrate shorten the gap between a failure and a fix.
Is a bigger pool always better?
Size reduces payout variance but also concentrates hashrate. What matters more is fee structure, uptime, latency and payout cadence.
Buy on break-even, not on hashrate
Ranking tables are a good way to discover which models still earn anything at today's price and difficulty; they are a poor way to decide what to pay for a used unit, because revenue per terahash is the same everywhere and the differences that matter are on the cost side. Compute the break-even tariff for every listing you consider, compare it against the electricity price you will actually pay, and stress it against a higher difficulty before agreeing a price. Buyers who do that tend to discover their limit in a spreadsheet rather than in a monthly loss.
Data and sources: ViaBTC pricing and fee documentation[1][4], the miner ranking board[2], the profit calculator[3] and on-chain difficulty data. Network hashrate (1,003 EH/s), difficulty (132.76 T), the 3.125 BTC block subsidy and the BTC price of $84,692 were read on 21 September 2026. All margins are illustrative, assume $0.06/kWh unless stated, and change with difficulty, price and tariff.